DOMINANT ANALYTICAL SYSTEM
Only 1% from 7500 companies have really strong potential of growth. We use the advanced analytical tools to find them and to provide you this list
Market research
At the heart of our philosophy of choosing the leaders of the stock market lies the study of William J. O'Neil who analyzed the most profitable shares in the last 50 years and identified a number of fundamental and technical parameters that each outstanding company possessed. We use these studies to select 10 to 15 companies that have all the necessary fundamental indicators and in our opinion are market leaders.Data alaysis & neural network
The target price of the shares and the optimal stop-loss level is determined by the specially trained neural network that Data trading developed for us. The data is uploaded to a neural network that evaluates the data, compares them, and gives each parameter a certain weight and makes a prediction about the target share price and the stop-loss level.Analytical forecast
For a strong movement of any asset requires a catalyst, in the stock market, such a catalyst can serve as a significant difference between the projected and actual quarterly EPS earnings, as well as the difference between the actual and projected earnings received by the company for the quarter.Technical analysis
To determine the entry point, we use most of the technical indicators provided by the platform TradingView (wave analysis of Elliott Fibonacci numbers, support and resistance lines and so on) with reliable graphic models (a cup with a handle, a cup without a handle, a double base, a flat base).Psychological analysis
A 30% movement in the price of an asset depends on the market for another 30% of the industrial group in which the share is located and only 30% of the share itself Thanks to the Stock Twits platform, we monitor the general mood of the market participants regarding the whole market, each industrial group and separately needed sharesExamples of trade transactions
-
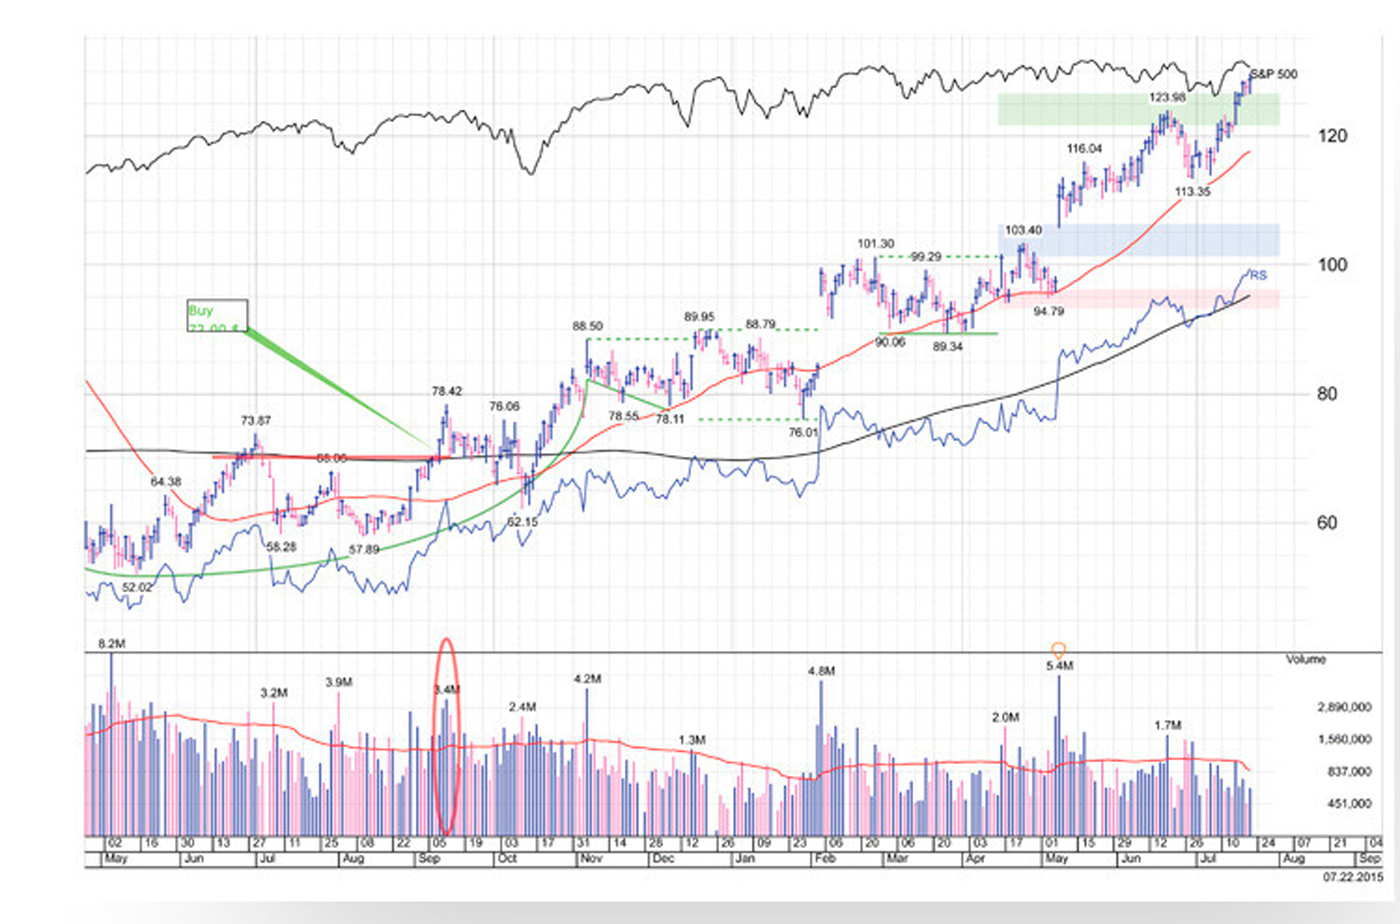
Long
Position Type -
02.09.2014
Opening date -
88.00 $
Entry price -
180.40 $
Target price -
9 mounths, 15 days
Period of investment -
Reached
Status -
105%
Earned profit
Chinese provider of internet-content and marketing services.
March 2004
FoundedSanta Clara, California, U.S.
HeadquartersMark D. McLaughlin
CEO-
2012-07-20
IPO -
68,3 Million
Shares Outstanding
-
NYSE
Stock Exchange -
$12.15 Billion
Capitalization
-
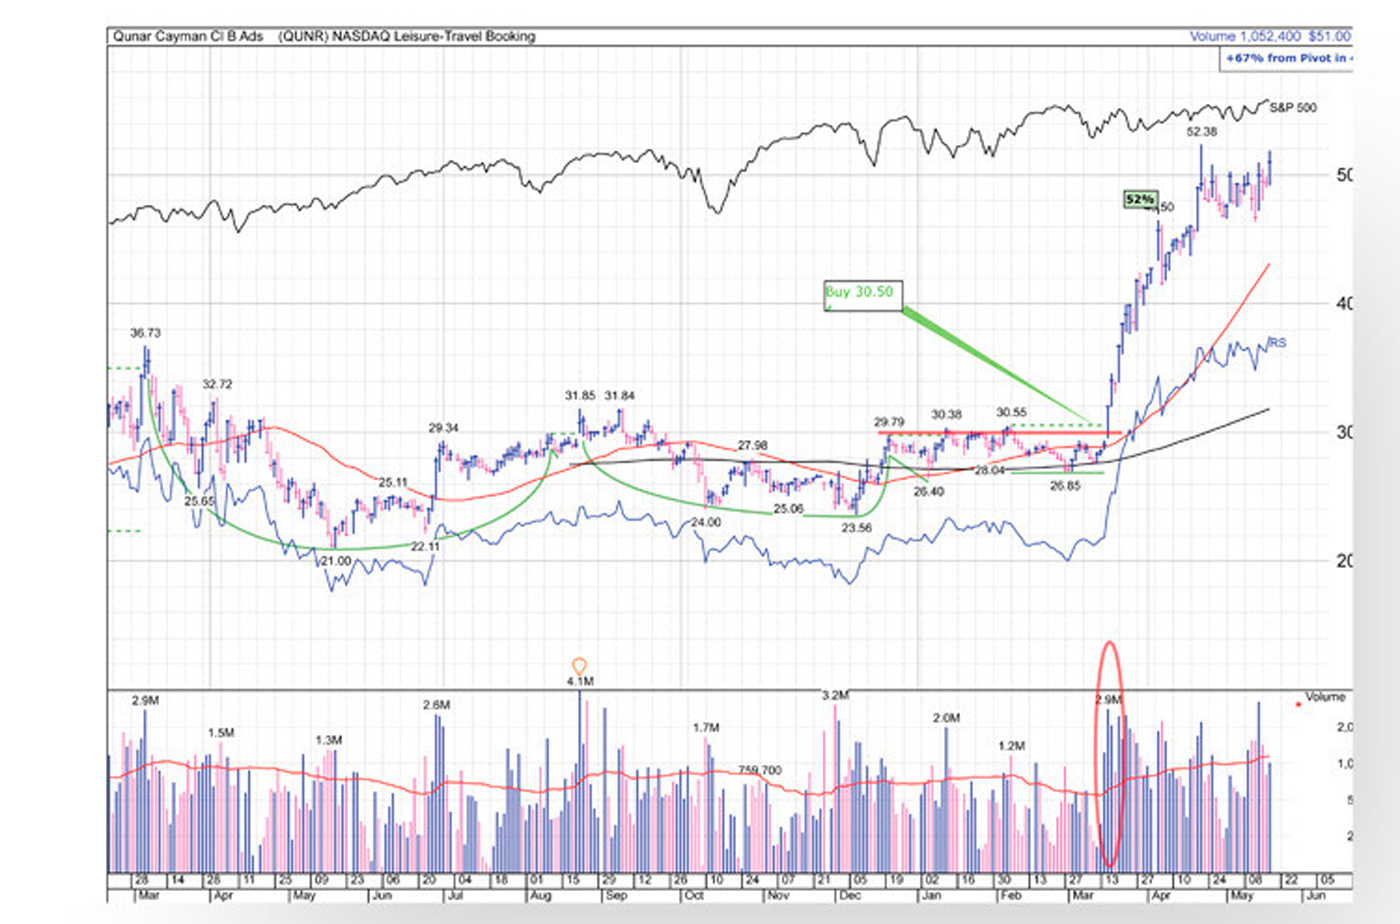
Long
Position Type -
17.03.2015
Opening date -
30.50 $
Entry price -
48.80 $
Target price -
1 month, 14 days
Period of investment -
Reached
Status -
60%
Earned profit
Chinese provider of online travel deals offering flight and hotel bookings via
June 2006
FoundedBeijing, China
HeadquartersYanhong Yanhong Li
CEO-
2013-11-01
IPO -
7,62 Million
Shares Outstanding
-
NYSE
Stock Exchange -
$5,60 Billion
Capitalization
-
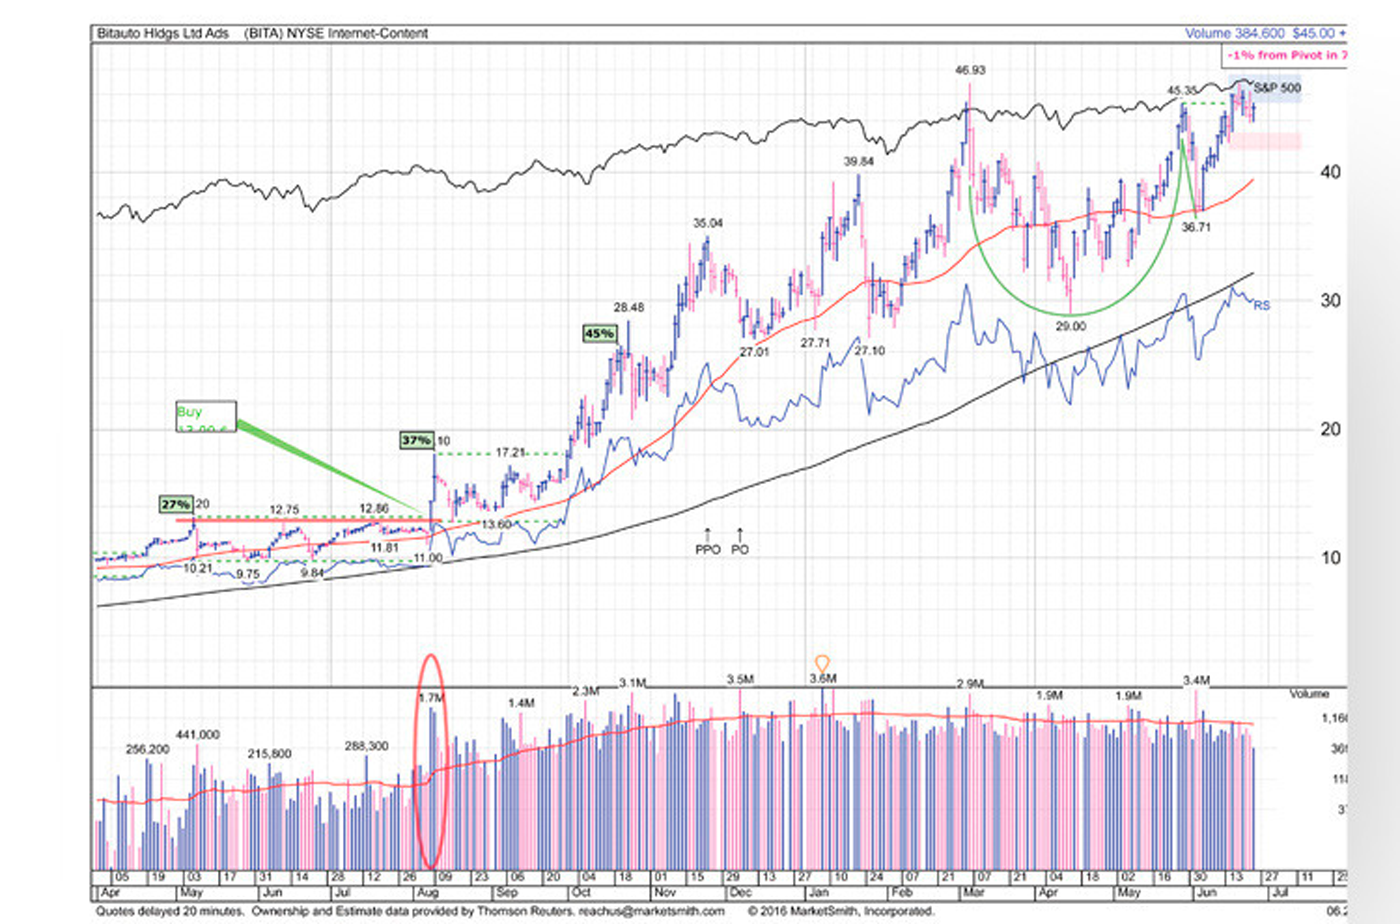
Long
Position Type -
08.08.2013
Opening date -
13.00 $
Entry price -
39.00 $
Target price -
5 month, 5 days
Period of investment -
Reached
Status -
200%
Earned profit
Chinese provider of internet-content and marketing services.
April of 2002
FoundedBeijing, China
HeadquartersBin Li
CEO-
2010-11-18
IPO -
23,0 Million
Shares Outstanding
-
NYSE
Stock Exchange -
$3,53 Billion
Capitalization
-
Long
Position Type -
10.09.2014
Opening date -
71.50 $
Entry price -
114.40 $
Target price -
8 month, 9 days
Period of investment -
Reached
Status -
60%
Earned profit

Develops visualized analytics software for various business intelligence applications
August 2003
FoundedSeattle, Washington, U.S.
HeadquartersChristian Chabot
CEO-
2013-05-17
IPO -
49,4 Million
Shares Outstanding
-
NYSE
Stock Exchange -
$6,93 Billion
Capitalization
-
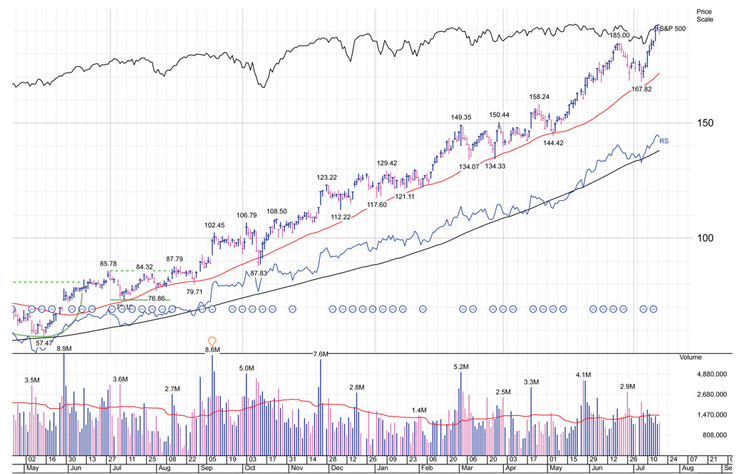
Long
Position Type -
18.09.2013
Opening date -
52.00 $
Entry price -
156.00 $
Target price -
5 month, 13 days
Period of investment -
Reached
Status -
200%
Earned profit

Chinese online discount retailer offering branded apparel at discount prices and limited quantities via vipshop.сom
May of 2011
FoundedBeijing, China
HeadquartersJinbo Yao
CEO-
2013-20-31
IPO -
46,7 Million
Shares Outstanding
-
NYSE
Stock Exchange -
$6,94 Billion
Capitalization
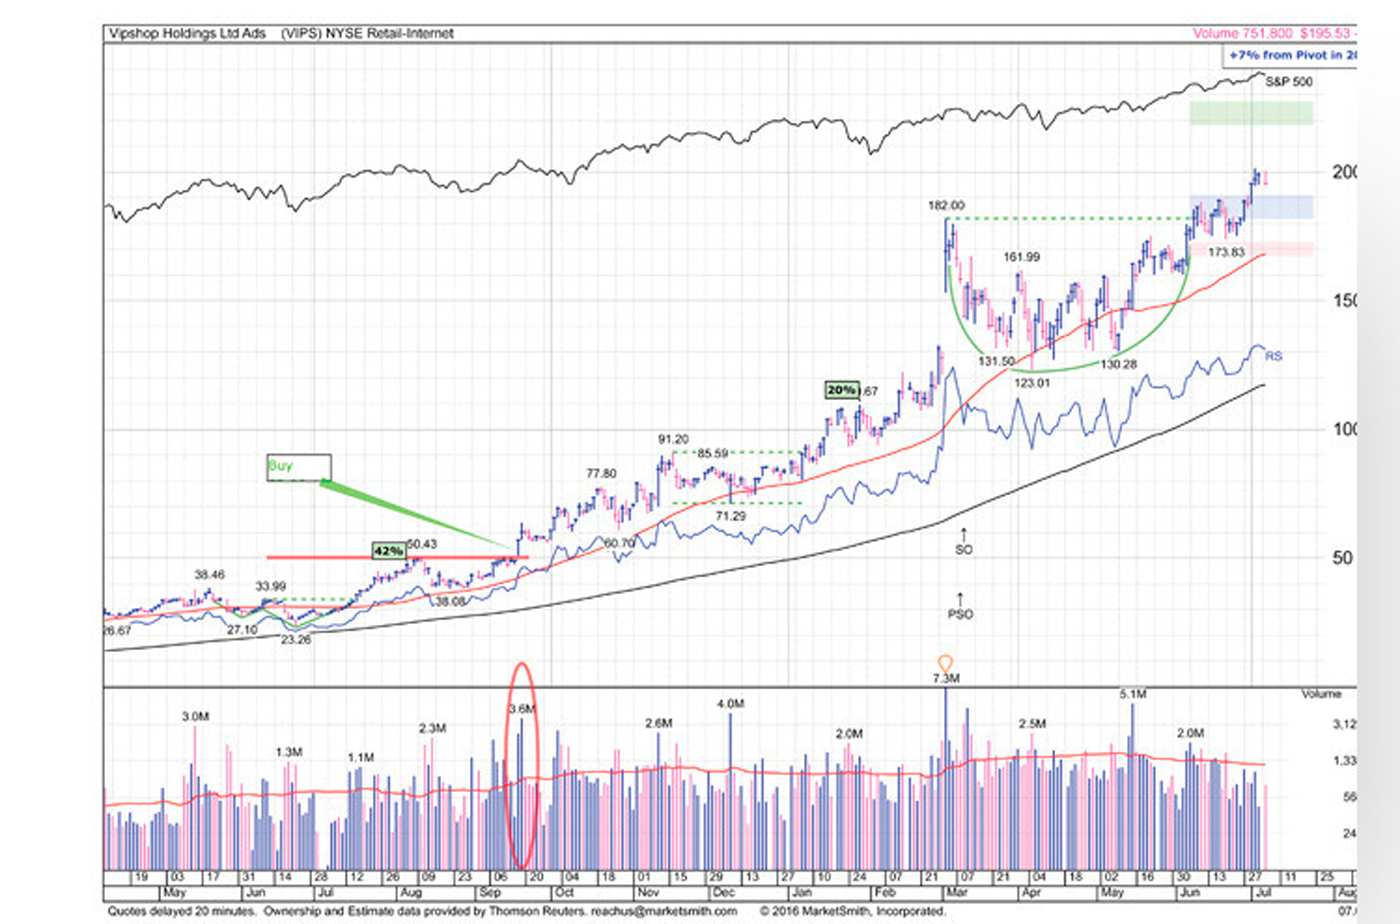
-
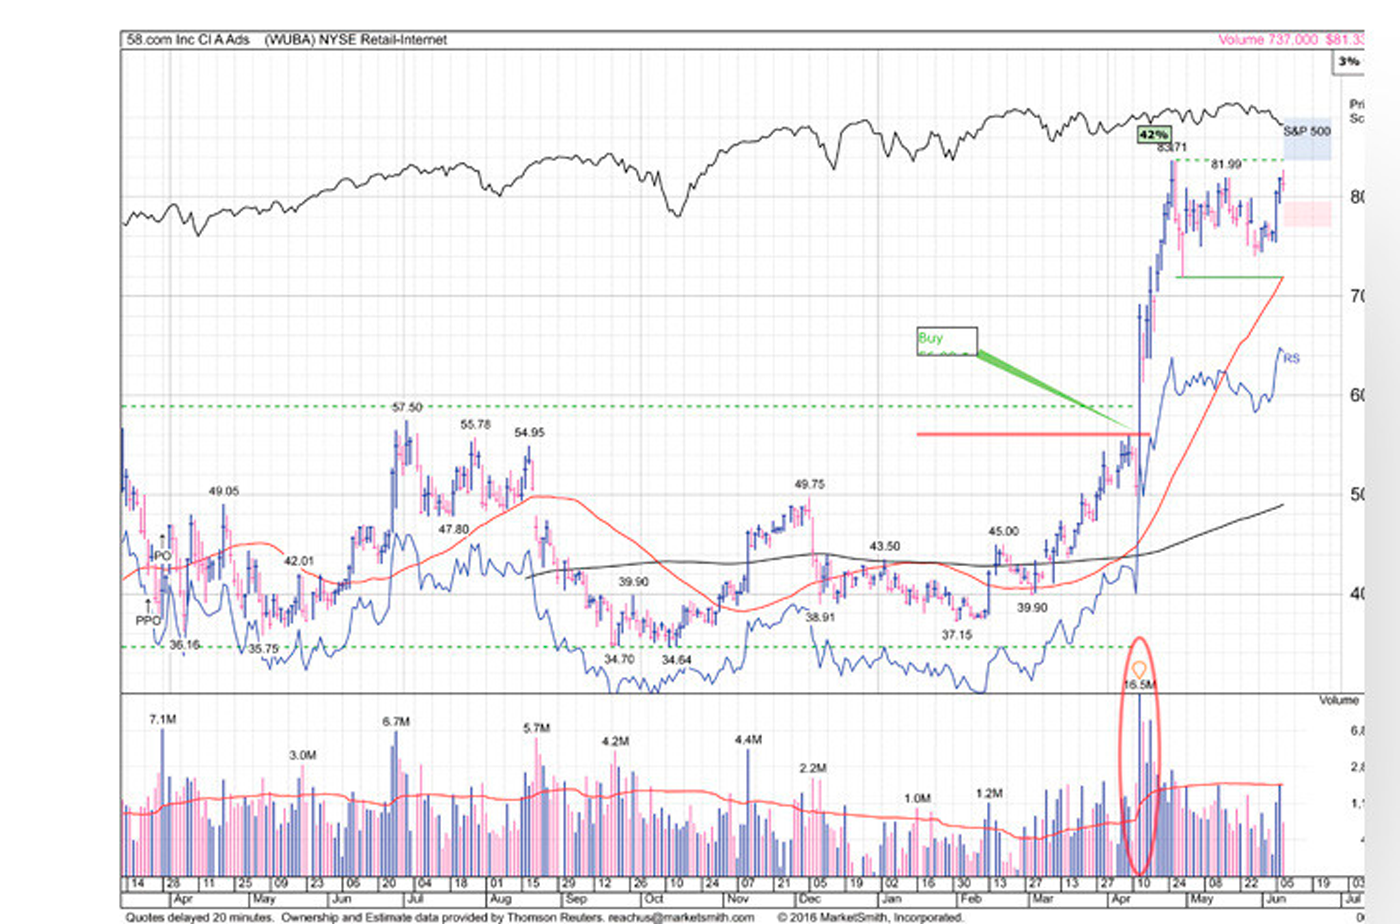
Long
Position Type -
14.01.2015
Opening date -
56.00 $
Entry price -
78.40 $
Target price -
9 days
Period of investment -
Reached
Status -
40%
Earned profit
Chinese operator of an online marketplace serving local merchants and consumers via 58.com and mobile apps
May of 2011
FoundedBeijing, China
HeadquartersJinbo Yao
CEO-
2013-20-31
IPO -
46,7 Million
Shares Outstanding
-
NYSE
Stock Exchange -
$6,94 Billion
Capitalization